

Goroutine 泄露排查 - poslua | ms2008 Blog
source link: https://ms2008.github.io/2019/06/02/golang-goroutine-leak/?
Go to the source link to view the article. You can view the picture content, updated content and better typesetting reading experience. If the link is broken, please click the button below to view the snapshot at that time.
Goroutine 泄露排查
pprof 无他
Posted by ms2008 on June 2, 2019我们在发布一个 go 应用时,默认都会启用两个 http handler: 一个是 pprof,方便线上动态追踪问题;另外一个是 prometheus 的 metrics,这样就可以通过 grafana 准实时的监控当前 runtime 信息,及时预警。就像下面这样:
package router

import (
	"net/http"
	_ "net/http/pprof"

	"github.com/prometheus/client_golang/prometheus/promhttp"
)

func InitAdmin() {
	adminRouter := http.DefaultServeMux
	adminRouter.Handle("/metrics", promhttp.Handler())

	adminServer = &http.Server{
		Addr:           ":8081",
		Handler:        adminRouter,
	}

	go func() {
		if err := adminServer.ListenAndServe(); err != nil {
			println("ListenAndServe admin: ", err.Error())
		}
	}()
}
最近我在优化一个 push 服务的时候,便观察到了一个 goroutine 泄露问题:
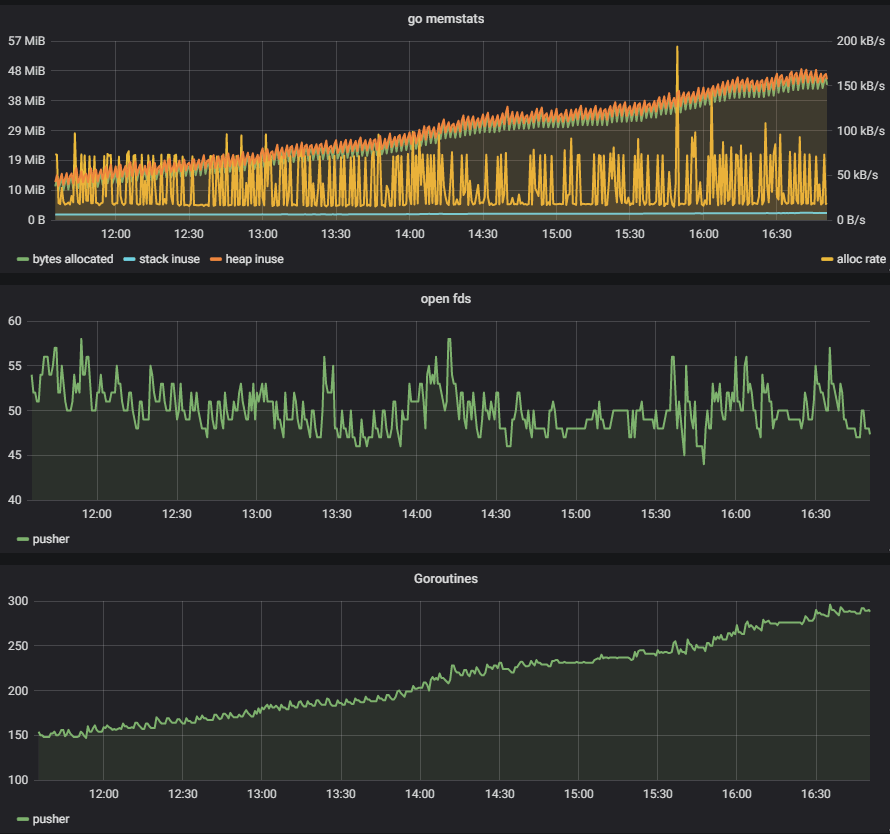
测试的客户端仅仅 30 个左右,基本都不会很活跃,但是却看到 goroutine 在持续上涨。怎么查出那些异常的 goroutine 呢?我所知道的有下面几个方法:
- 给程序发送
SIGQUIT信号,也就是kill -3 pid - 程序中监听信号,之后通过
runtime.Stack()获取所有 goroutine 信息 - 通过 pprof 获取
/debug/pprof/goroutine
第一种方法会丢失第一现场,并且很难溯源,所以一般在很早期的测试时使用。第二种要提前在程序中埋好点,也是很多开源项目中使用的方法。但是我更喜欢使用第三种方法,pprof 大家一般都是生成 CPU、MEM 火焰图来分析性能问题,殊不知其 HTTP 的接口是分析 goroutine 泄露绝佳的工具。
就拿我的这次案例来说,直接通过 HTTP 地址就可以拿到所有的 goroutine 概况:
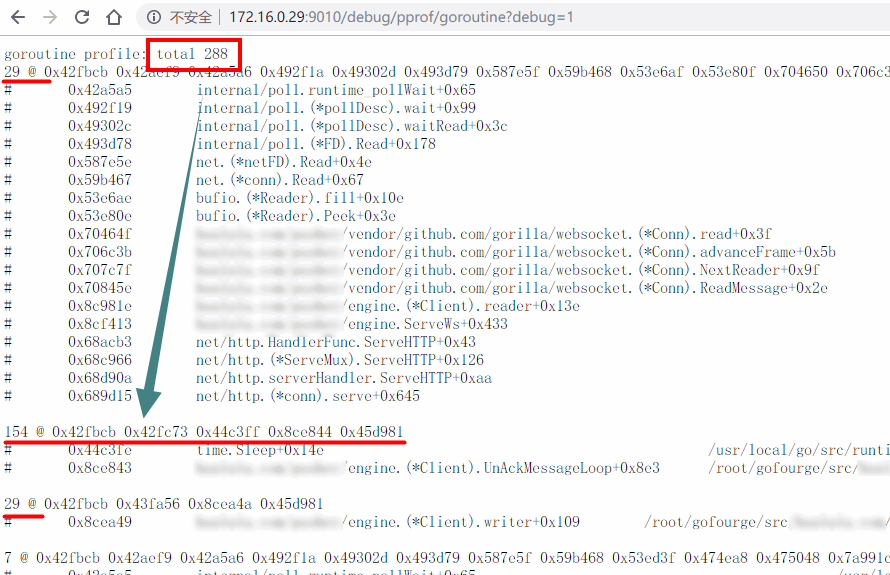
可以看到一共有 288 个 goroutine, 但是客户端只有 29 个(一读一写还有一个消息重传),消息重传却有 154 个(理论上也应该是 29 个)。很明显就是 ack 泄露导致的,通过修改请求参数 debug=2,可以看到更多细节:
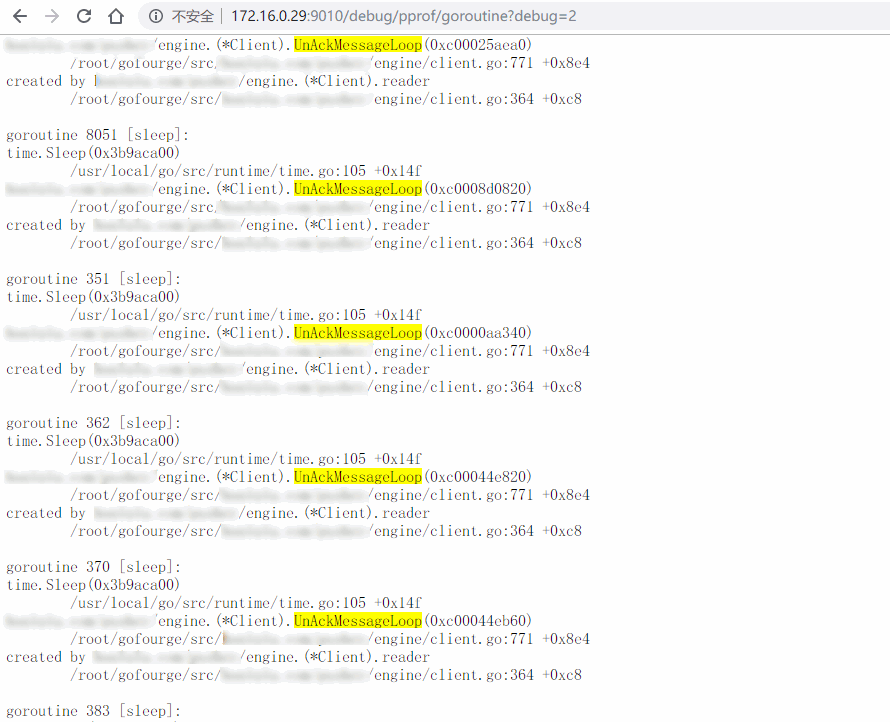
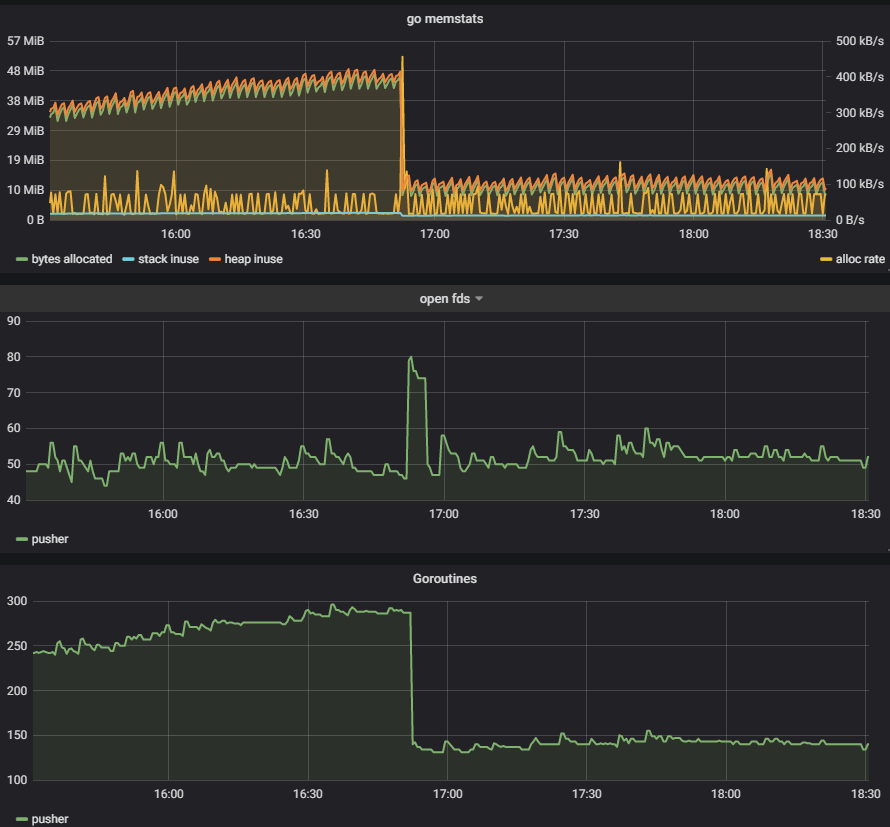
上面这个图是我修复之后补得,实际上应该能看到 ack 是由于阻塞在 channel 的接收中。经过一番排查,问题最终定位在 reader 和 writer 在退出的时候没有正确关闭 channel 导致。修复后,可以看到 goroutine 的曲线明显趋于平缓:
Recommend
About Joyk
Aggregate valuable and interesting links.
Joyk means Joy of geeK