

Using the Go execution tracer to speed up fractal rendering
source link: https://medium.com/@francesc/using-the-go-execution-tracer-to-speed-up-fractal-rendering-c06bb3760507
Go to the source link to view the article. You can view the picture content, updated content and better typesetting reading experience. If the link is broken, please click the button below to view the snapshot at that time.
Using the Go execution tracer to speed up fractal rendering
Originally posted on campoy.cat
As an experiment, this is the first blog post form of a justforfunc episode, you can also watch the corresponding episode.
The initial program
We start with a very simple program, copied partly from Wikipedia, that creates a Mandelbrot fractal by first computing the color of each pixel, and then writing the corresponding image to a PNG file.
func main() {
	f, err := os.Create(output)
	if err != nil {
		log.Fatal(err)
	}	img := createSeq(width, height)	if err = png.Encode(f, img); err != nil {
		log.Fatal(err)
	}
}
In this first iteration createSeq, which calls pixel to compute the color of each pixel, one after the other.
func createSeq(width, height int) image.Image {
	m := image.NewGray(image.Rect(0, 0, width, height))
	for i := 0; i < width; i++ {
		for j := 0; j < height; j++ {
			m.Set(i, j, pixel(i, j, width, height))
		}
	}
	return m
}
Finally, the part that is basically extracted from Wikipedia allows us to compute the color of a given pixel. The complexity value determines how complex the fractal gets, values from 4 to 2048 give various and interesting effects. Play with this!
func pixel(i, j, width, height int) color.Color {
	// Play with this constant to increase the complexity of the fractal.
	// In the justforfunc.com video this was set to 4.
	const complexity = 1024	xi := norm(i, width, -1.0, 2)
	yi := norm(j, height, -1, 1)	const maxI = 1000
	x, y := 0., 0.	for i := 0; (x*x+y*y < complexity) && i < maxI; i++ {
		x, y = x*x-y*y+xi, 2*x*y+yi
	}	return color.Gray{uint8(x)}
}
How fast is it?
At this point our program runs and creates a cool fractal, and it takes (in my laptop) around 4.7 seconds.
$ time ./mandelbrot
./mandelbrot  4.44s user 0.01s system 99% cpu 4.466 total
The resulting image is this cool fractal.

Can we make it faster? pprof
In order to obtain more information about how the program performs we can profile the CPU usage with the runtime/pprof package in the standard library.
Simply adding two lines of code at the beginning of the main function.
pprof.StartCPUProfile(os.Stdout)
defer pprof.StopCPUProfile()
Now if we run the program again it will output pprof profiling information into the standard output.
$ time ./mandelbrot > cpu.pprof
./mandelbrot > cpu.pprof  5.25s user 0.02s system 96% cpu 5.469 total
Interestingly, adding pprof has not slowed the program much! And in exchange of that temporary performance hit we get much visibility on what the program spent its time on.
Let’s open pprof and see what it spent its time on.
$ go tool pprof cpu.pprof
Type: cpu
Time: Oct 23, 2017 at 11:04am (CEST)
Duration: 5.45s, Total samples = 4.53s (83.13%)
Entering interactive mode (type "help" for commands, "o" for options)
(pprof)
We can now list how much time we spend in each function we call with list.
(pprof) list main.main
Total: 4.53s
ROUTINE ======================== main.main in /Users/campoy/src/github.com/campoy/justforfunc/22-perf/main.go
         0      4.15s (flat, cum) 91.61% of Total
         .          .     39:   f, err := os.Create(output)
         .          .     40:   if err != nil {
         .          .     41:           log.Fatal(err)
         .          .     42:   }
         .          .     43:
         .      3.89s     44:   img := createSeq(width, height)
         .          .     45:
         .      260ms     46:   if err = png.Encode(f, img); err != nil {
         .          .     47:           log.Fatal(err)
         .          .     48:   }
         .          .     49:}
         .          .     50:
         .          .     51:// createSeq fills one pixel at a time.
Ok, so it seems we spent most of the time in createSeq, makes sense!
(pprof) list main.createSeq
Total: 4.53s
ROUTINE ======================== main.createSeq in /Users/campoy/src/github.com/campoy/justforfunc/22-perf/main.go
         0      3.89s (flat, cum) 85.87% of Total
         .          .     51:// createSeq fills one pixel at a time.
         .          .     52:func createSeq(width, height int) image.Image {
         .          .     53:   m := image.NewGray(image.Rect(0, 0, width, height))
         .          .     54:   for i := 0; i < width; i++ {
         .          .     55:           for j := 0; j < height; j++ {
         .      3.89s     56:                   m.Set(i, j, pixel(i, j, width, height))
         .          .     57:           }
         .          .     58:   }
         .          .     59:   return m
         .          .     60:}
         .          .     61:
Great, again most of the time is in the line calling pixel, and what does pixel do?
(pprof) list main.pixel
Total: 4.53s
ROUTINE ======================== main.pixel in /Users/campoy/src/github.com/campoy/justforfunc/22-perf/main.go
     2.01s      3.87s (flat, cum) 85.43% of Total
         .          .    209:func pixel(i, j, width, height int) color.Color {
         .          .    210:   // Play with this constant to increase the complexity of the fractal.
         .          .    211:   // In the justforfunc.com video this was set to 4.
         .          .    212:   const complexity = 1024
         .          .    213:
         .       10ms    214:   xi := norm(i, width, -1.0, 2)
         .          .    215:   yi := norm(j, height, -1, 1)
         .          .    216:
         .          .    217:   const maxI = 1000
         .          .    218:   x, y := 0., 0.
         .          .    219:
     1.29s      1.29s    220:   for i := 0; (x*x+y*y < complexity) && i < maxI; i++ {
     720ms      720ms    221:           x, y = x*x-y*y+xi, 2*x*y+yi
         .          .    222:   }
         .          .    223:
         .      1.85s    224:   return color.Gray{uint8(x)}
         .          .    225:}
Ok, so we spend a decent amount of time computing multiplications in that loop, also a lot of time allocating pixels in line 224.
So what now?
We have a better idea of what our program spends most of the time: computing pixel values. But what do we do now? It seems reasonable that a program that generates fractals spends most of the time, well … generating fractals!
There’s things we could do to try and optimize the CPU time, but in this post instead of going that way, we’re going to see what other things we can do to speed up the program without changing the pixelfunction.
Meet the tracer
One of the problems of pprof is that it is a stastistical way of discovering how often a given piece of code is running. It allows us to understand what the program is running when it’s on the CPU, but what about when it’s not? We’re missing information that we can not (or at least not easily) extract from a pprof trace.
The Go execution tracer, rather than pinging the program regularily to understand what it is up to, it instead hooks to the Go runtime to log every single event we care about. These events include:
- go routine creation and destruction
- blocking events such as channel or mutex operations
- system calls
The most powerful side of the Go execution tracer is the amazing visualization it generates, which allows us to see the “empty” space in our program.
Let’s create a trace from this program, by simply replacing our pprof calls by calls to the runtime/tracepackage also in the standard library.
trace.Start(os.Stdout)
defer trace.Stop()
Then we can execute the program again an visualize the trace with go tool trace.
$ time ./mandelbrot > seq.trace
./mandelbrot > seq.trace  5.11s user 0.04s system 99% cpu 5.176 total$ go tool seq.trace
2017/10/23 11:16:55 Parsing trace...
2017/10/23 11:16:55 Serializing trace...
2017/10/23 11:16:55 Splitting trace...
2017/10/23 11:16:55 Opening browser
This will open a browser and display a webpage that, among others, has a link to View Trace. Click there and you should be something like this:
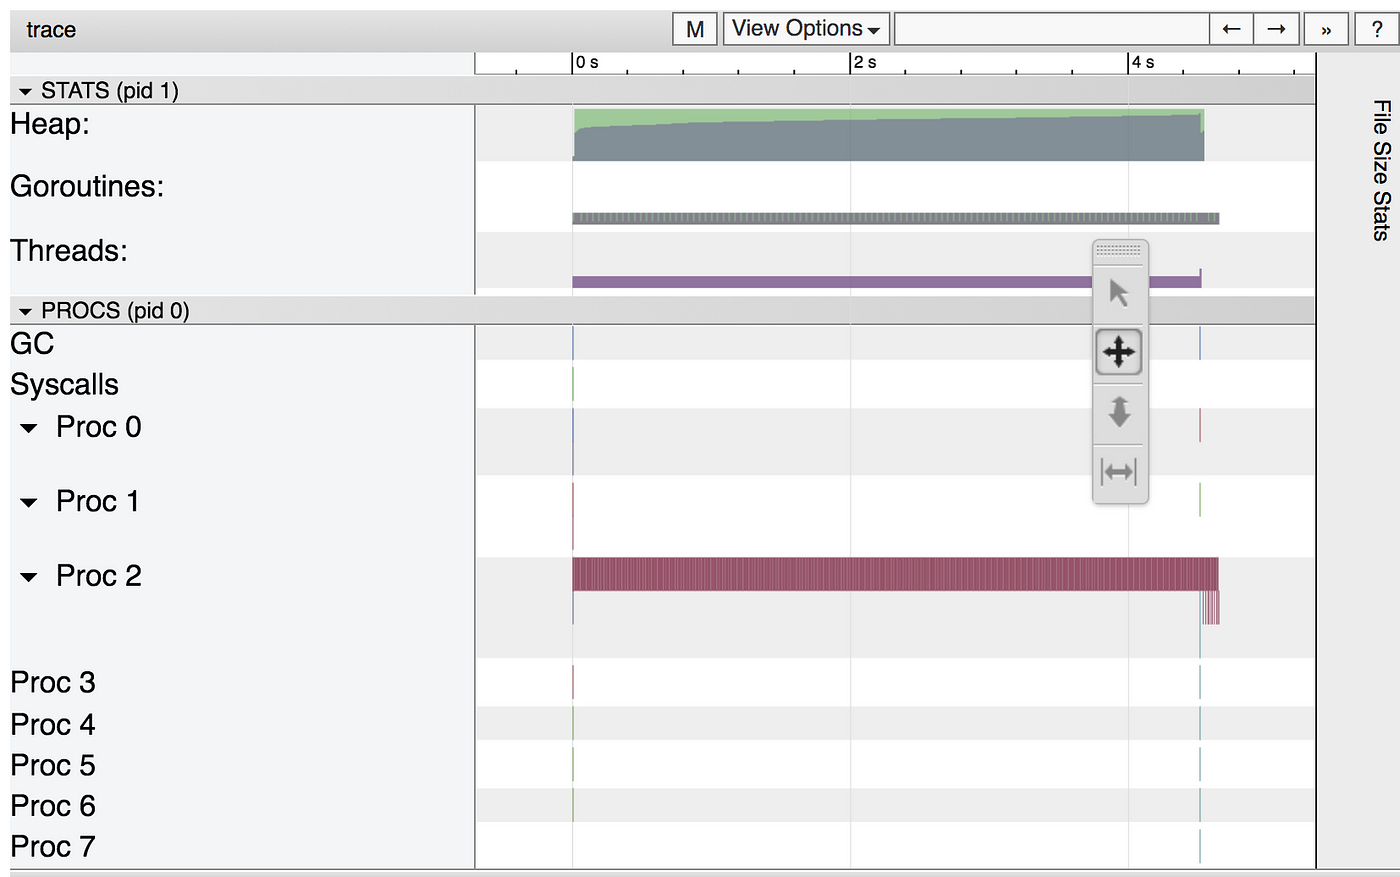
I invite you to explore the visualization, specially the garbage collection event towards the end. But the most important point here is everything we can’t see.
Do you see those 8 Proc? Those are the eight processors that my laptop has. Only one of them, processor 2 in my case, is really doing any work!
One of Go’s powers is easy concurrency, right? Well, it’s time to use those, because we clearly are wasting CPU time by not expressing our program in a concurrent way which would enable parallelism.
More concurrency, more parallelism, more speed!
Let’s go to a ridiculuous extreme and decide that, since each pixel can be computed concurrently, we are going to create a goroutine per pixel. This, for our 2048x2048 image, means we’re going to create over four million goroutines. We say goroutines are cheap … so let’s seee if that’s true!
The function that creates a goroutine per pixel is called createPixel:
func createPixel(width, height int) image.Image {
	m := image.NewGray(image.Rect(0, 0, width, height))
	var w sync.WaitGroup
	w.Add(width * height)
	for i := 0; i < width; i++ {
		for j := 0; j < height; j++ {
			go func(i, j int) {
				m.Set(i, j, pixel(i, j, width, height))
				w.Done()
			}(i, j)
		}
	}
	w.Wait()
	return m
}
Ok, so first of all let’s run it without the tracer to see how fast it is and compare it to the sequential option.
$ time ./mandelbrot
./mandelbrot  13.70s user 1.53s system 471% cpu 3.234 total
Wow, it’s actually faster! It used much more CPU time (13.70s) but since it distributed it so efficiently across our eight CPUs, the total time it spent running was only 3.2 seconds.
Victory! Right?
Well, let’s create a trace and see what it looks like.
$ time ./mandelbrot > px.trace
./mandelbrot > px.trace  25.64s user 5.46s system 502% cpu 6.184 total
Wow, we spent almost twice of CPU cycles than before! Why is this? Well, the tracer has a performance cost, and in this case we’re logging each and every goroutine we create. This, by itself, might point to problem in our solution.
Let’s open the trace, and be warned it’s not going to be fast!
$ go tool trace px.trace
2017/10/23 11:29:17 Parsing trace...
2017/10/23 11:29:58 Serializing trace...
2017/10/23 11:30:13 Splitting trace...
2017/10/23 11:30:49 Opening browser
Note: you will need to pass the binary as before px.trace if you are using Go 1.8 or earlier versions.
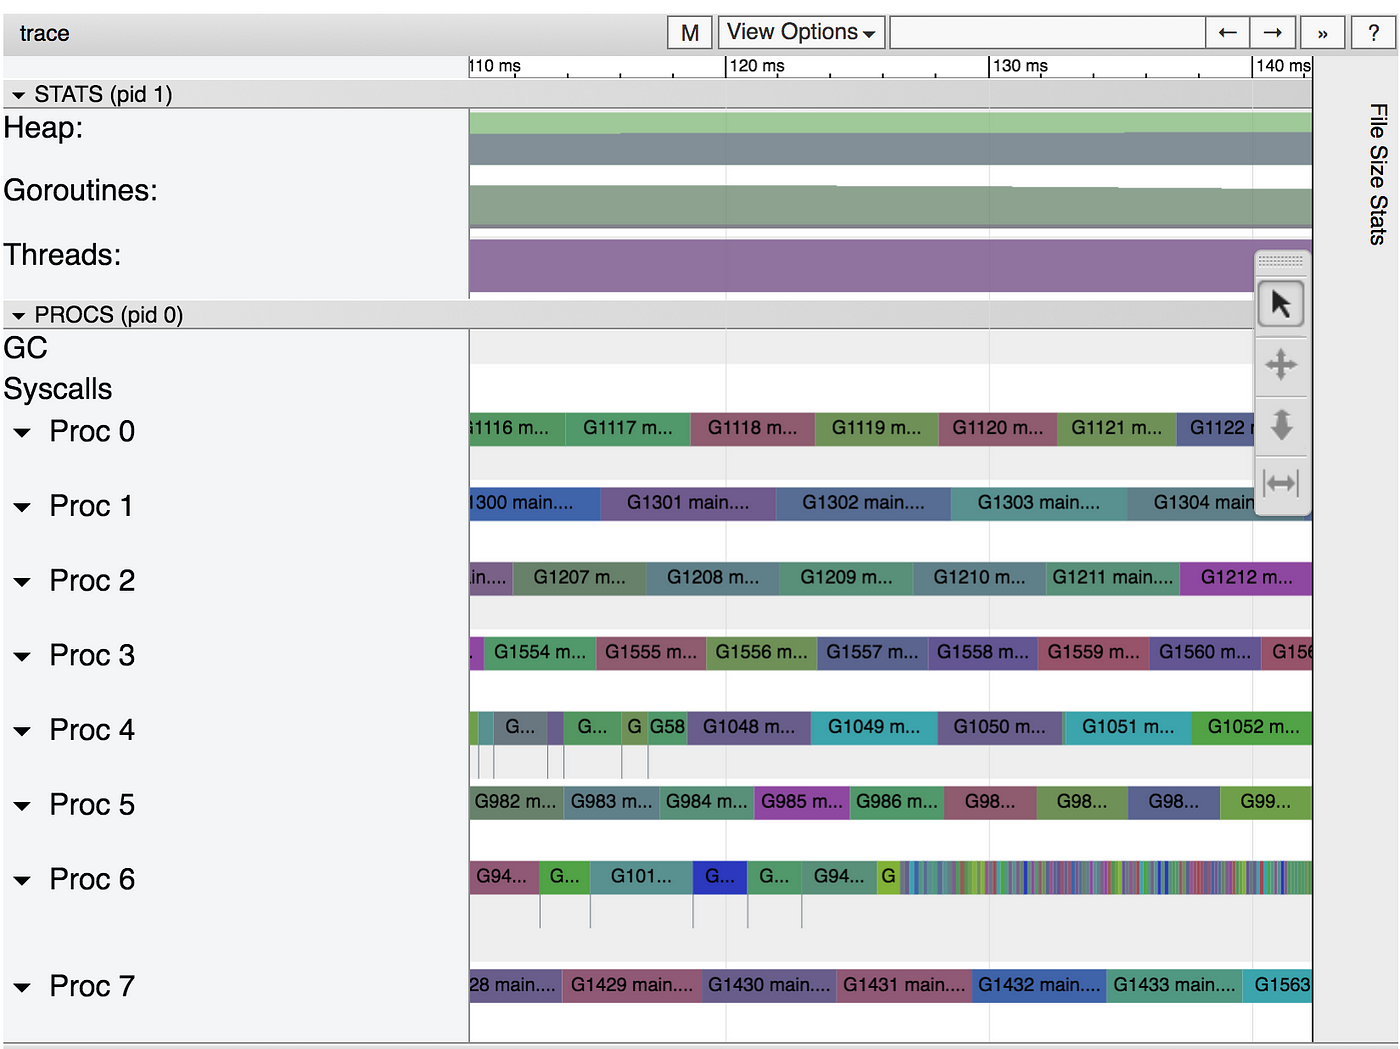
The trace has been split into many pieces to avoid overloading the browser. Let’s open one somewhere around the center. This, again, will be quite slow. Patience is your friend.
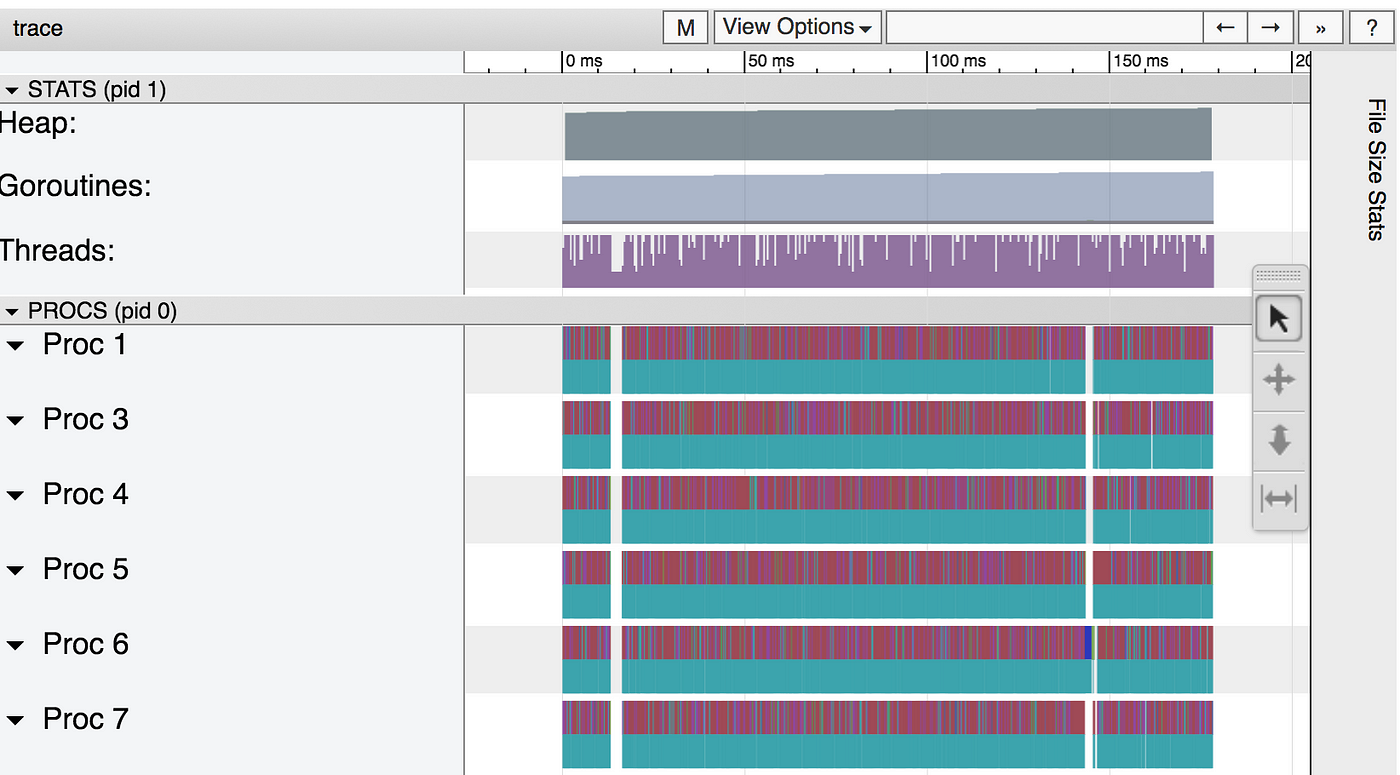
It seems like the CPUs are really busy this time! But, let’s zoom in a bit.
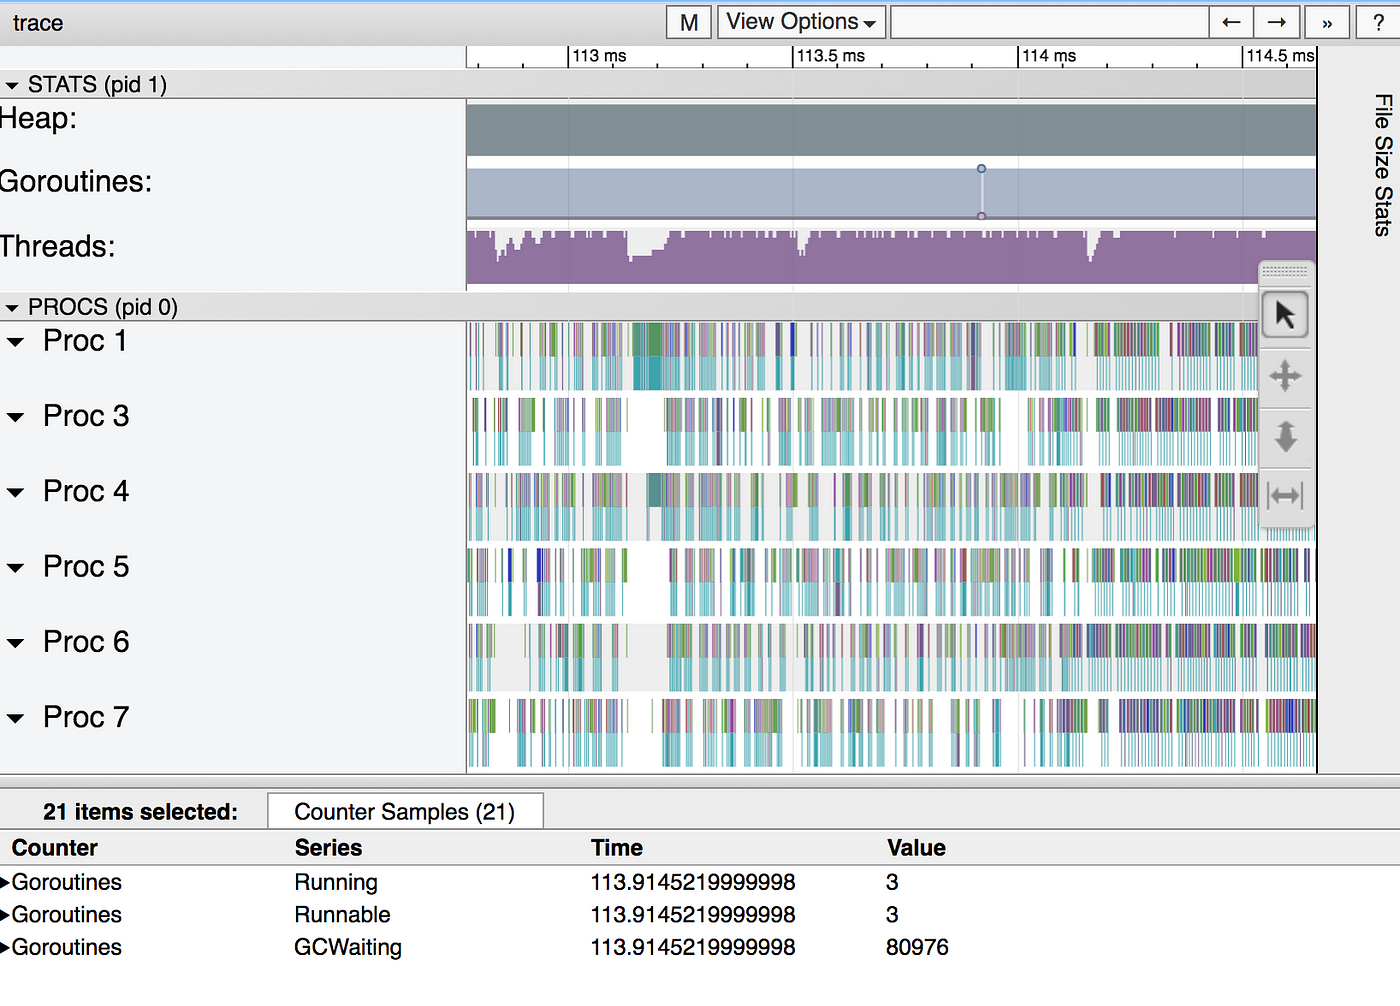
Oh, that doesn’t seem like it’s very well utilized after all. We’ve created too many goroutines, which causes too much pressure on the runtime, both the scheduler and the garbage collector, and it shows as contention and wasted CPU time.
On go routines and dataraces
Ok, so … is this program correct? Are there any data races? The easiest way to show that there are no obvious data races is by using the data race detector.
To do so you can simply add -race to the go build|run|test command. If you try it with the program as is it will fail:
$ go build -o mandelbrot -race
$ time ./mandelbrot
race: limit on 8192 simultaneously alive goroutines is exceeded, dying
./mandelbrot  0.49s user 1.00s system 99% cpu 1.483 total
There’s a limit of 8192 alive goroutines, and with 4 millions we clearly exceed it. Instead let’s use the benchmarks I wrote, which generate smaller images.
Let’s run it with and without the data race detector to compare the performances.
$ go test -bench=Pixel
goos: darwin
goarch: amd64
pkg: github.com/campoy/justforfunc/22-perf
BenchmarkPixel/64-8                 2000           1003116 ns/op
BenchmarkPixel/128-8                 300           5003258 ns/op
BenchmarkPixel/256-8                 100          19693236 ns/op
BenchmarkPixel/512-8                  20          86670280 ns/op
PASS
ok      github.com/campoy/justforfunc/22-perf   7.894s$ go test -bench=Pixel -race
go test -bench=Pixel -race
goos: darwin
goarch: amd64
pkg: github.com/campoy/justforfunc/22-perf
BenchmarkPixel/64-8                   10         181391401 ns/op
BenchmarkPixel/128-8                   2         729349776 ns/op
BenchmarkPixel/256-8                   1        2923114988 ns/op
BenchmarkPixel/512-8                   1        12477182754 ns/op
PASS
ok      github.com/campoy/justforfunc/22-perf   20.626s
There’s a clear difference, but the good news it’s it didn’t panic. This means no data races were detected. There might be some data race, but the code we just run didn’t cause any.
In a previous version of the code (see the video for more details) the anonymous function in the go routine didn’t get any parameters. This caused a data race on both i and j.
func createPixel(width, height int) image.Image {
	m := image.NewGray(image.Rect(0, 0, width, height))
	var w sync.WaitGroup
	w.Add(width * height)
	for i := 0; i < width; i++ {
		for j := 0; j < height; j++ {
			go func() {
				m.Set(i, j, pixel(i, j, width, height))
				w.Done()
			}()
		}
	}
	w.Wait()
	return m
}
It’s also worth mentioning that m.Set being called from different go routines is not a problem since we are modifying different positions in a preallocated slice.
Finding compromise in between too few and too many
Ok, so one goroutine is too few, but four millions is too many. Let’s go right in between and go with one goroutine per column. This time we’ll call createCol which creates a goroutine per column, so “only” 2048 of them.
func createCol(width, height int) image.Image {
	m := image.NewGray(image.Rect(0, 0, width, height))
	var w sync.WaitGroup
	w.Add(width)
	for i := 0; i < width; i++ {
		go func(i int) {
			for j := 0; j < height; j++ {
				m.Set(i, j, pixel(i, j, width, height))
			}
			w.Done()
		}(i)
	}
	w.Wait()
	return m
}
As before, let’s run it without trace first to see whether we improve the 3.2 seconds we got before.
$ time ./mandelbrot
./mandelbrot  4.90s user 0.02s system 499% cpu 0.985 total
Ok, we went from almost five seconds, to three, and now less than a second!
What does the trace look like? Let’s check it out.
$ time ./mandelbrot > col.trace
./mandelbrot > col.trace  4.79s user 0.02s system 498% cpu 0.966 total$ go tool trace col.trace
2017/10/23 11:41:29 Parsing trace...
2017/10/23 11:41:29 Serializing trace...
2017/10/23 11:41:30 Splitting trace...
2017/10/23 11:41:30 Opening browser
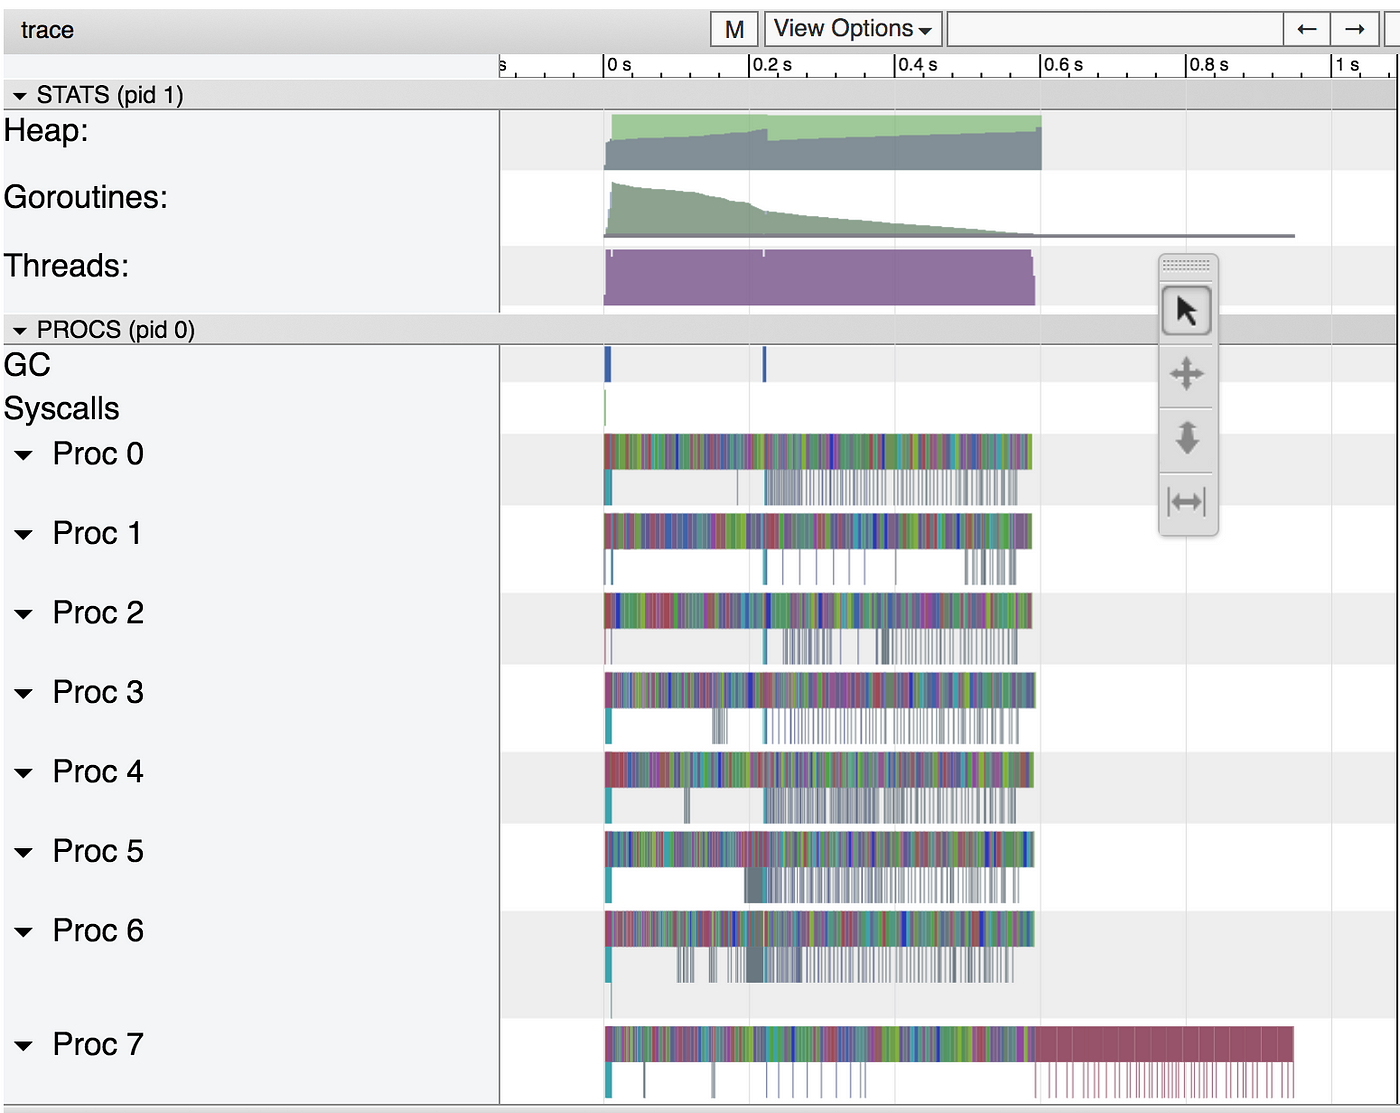
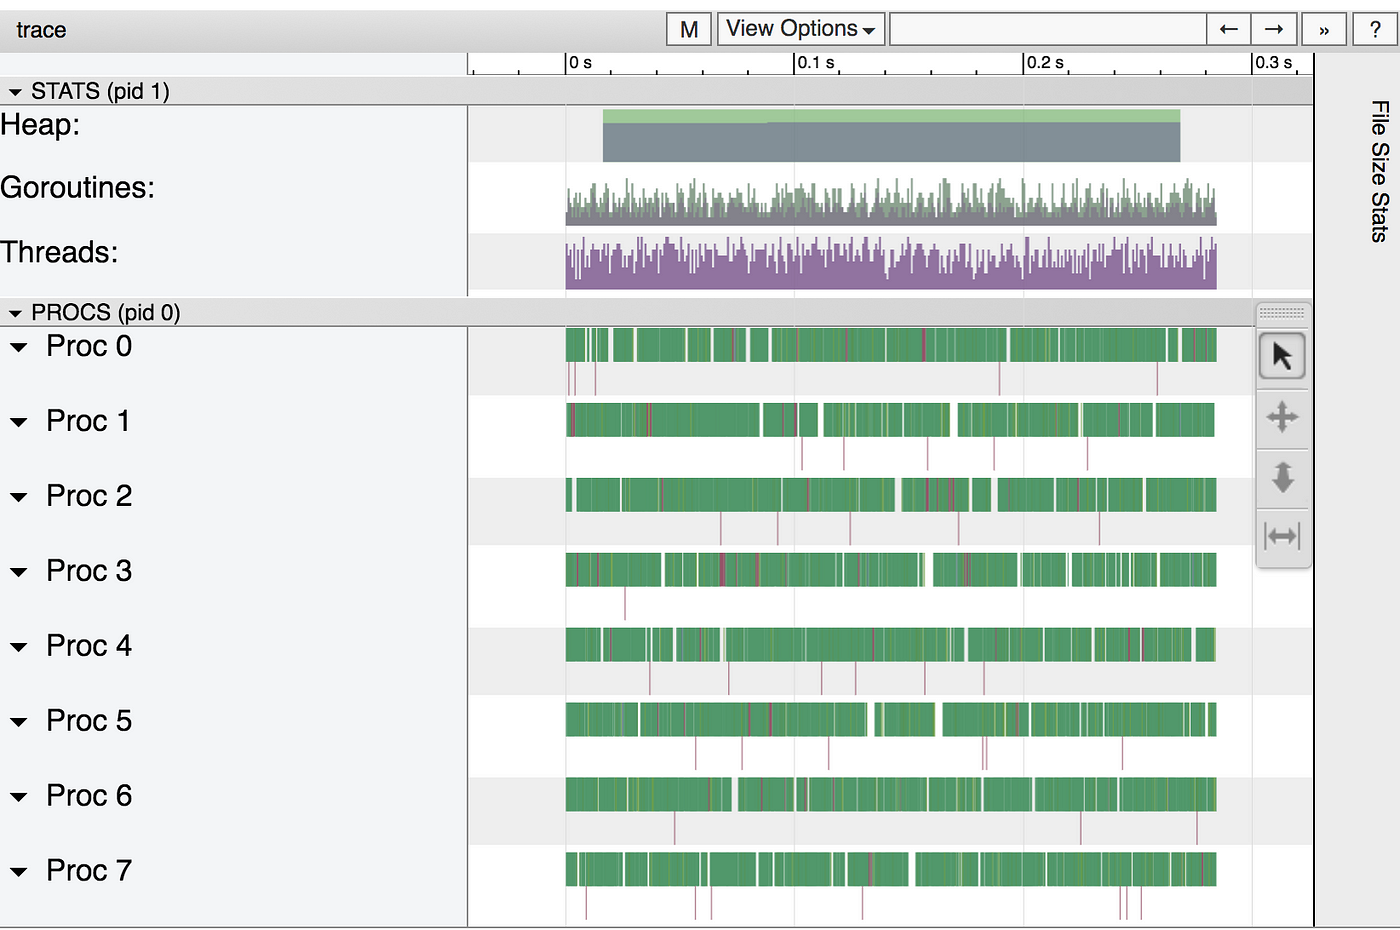
That looks pretty good! We can see that the CPUs are pretty busy first, then we move to one goroutine to encode the image into the file. Let’s zoom in, though (feeling like CSI already?).
That looks very good! But, can we do better?
What about the “workers” concurrency pattern?
If you’ve written enough Go, you migh have encountered the “workers” pattern, where we create a small number of workers (eight in this case) which fetch tasks from a channel. We also use a sync.WaitGroup to make sure all workers are done before exiting.
func createWorkers(width, height int) image.Image {
	m := image.NewGray(image.Rect(0, 0, width, height))	type px struct{ x, y int }
	c := make(chan px)	var w sync.WaitGroup
	for n := 0; n < numWorkers; n++ {
		w.Add(1)
		go func() {
			for px := range c {
				m.Set(px.x, px.y, pixel(px.x, px.y, width, height))
			}
			w.Done()
		}()
	}	for i := 0; i < width; i++ {
		for j := 0; j < height; j++ {
			c <- px{i, j}
		}
	}
	close(c)
	w.Wait()
	return m
}
We have a smaller number of goroutines, but definitely enough of them to distribute across all processors. This should be faster, right?
Well, never trust your instincts when it comes to performance analysis.
Let’s run it and see, first without the tracer.
$ time ./mandelbrot
./mandelbrot  10.31s user 3.22s system 422% cpu 3.201 total
Ok, so this is not better than creating a pixel per goroutine! Why? Well, time to trace.
$ time ./mandelbrot > workers.trace
./mandelbrot > workers.trace  30.86s user 13.88s system 383% cpu 11.660 total$ go tool trace workers.trace
2017/10/23 11:49:20 Parsing trace...
2017/10/23 11:49:52 Serializing trace...
2017/10/23 11:50:02 Splitting trace...
2017/10/23 11:50:49 Opening browser
This is again incredibly slow, so clearly we’re logging many events. What are those events?
Again it seems quite good from far away, but when you zoom in it looks quite different.
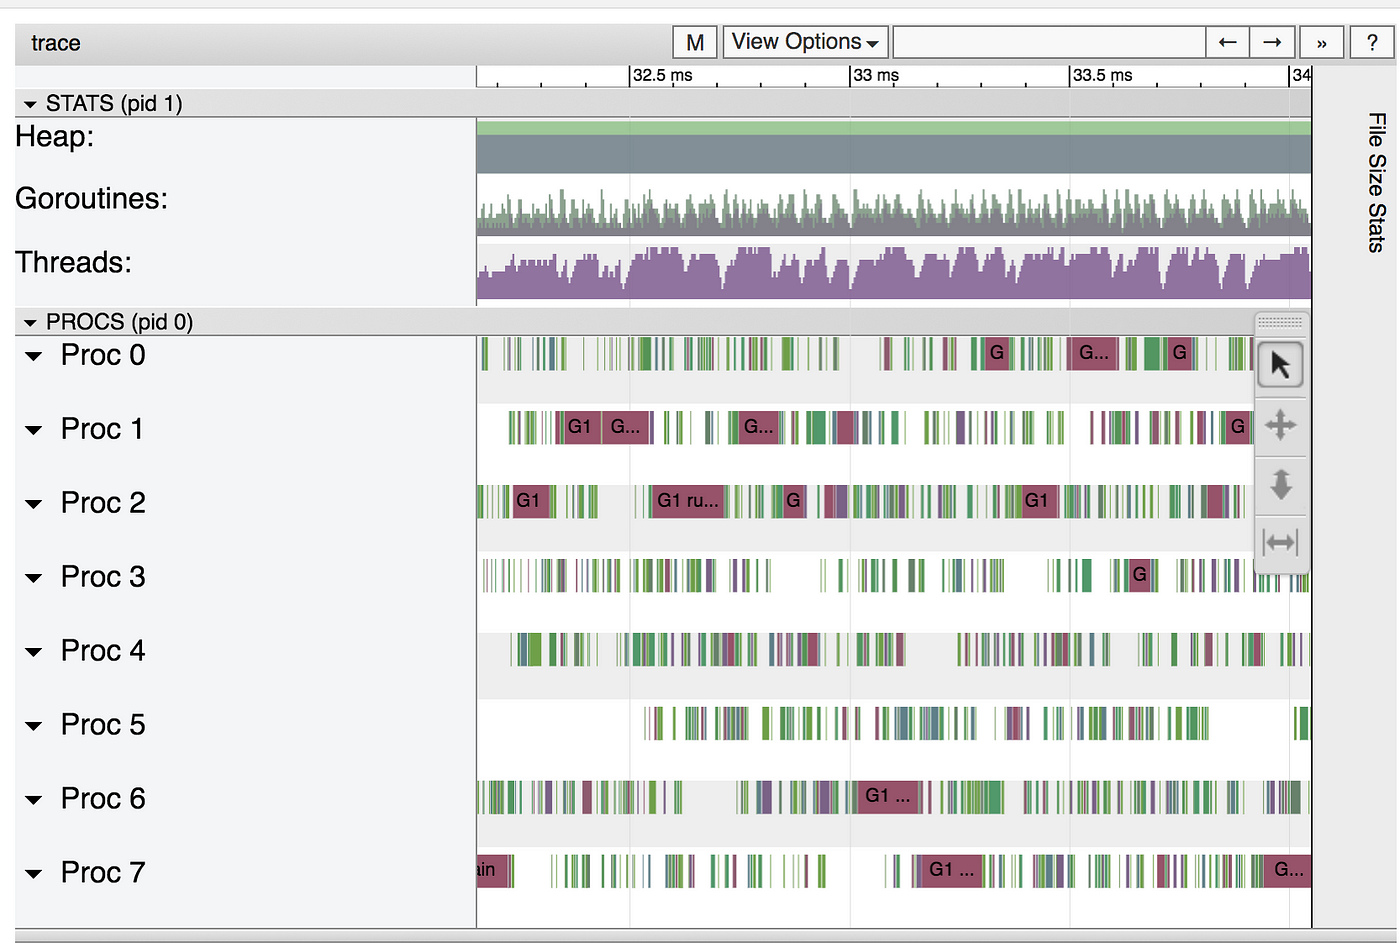
Where is the contention coming from now? The runtime should be totally fine with eight goroutines, 2048 was not too many. Well, let’s go back to the menu where we clicked “View Trace” but instead let’s click Synchronization blocking profile. You’ll see a graph generated by our old friend pprof. In this graph we can see the contention due to synchronization primitives such as channels and mutexes.
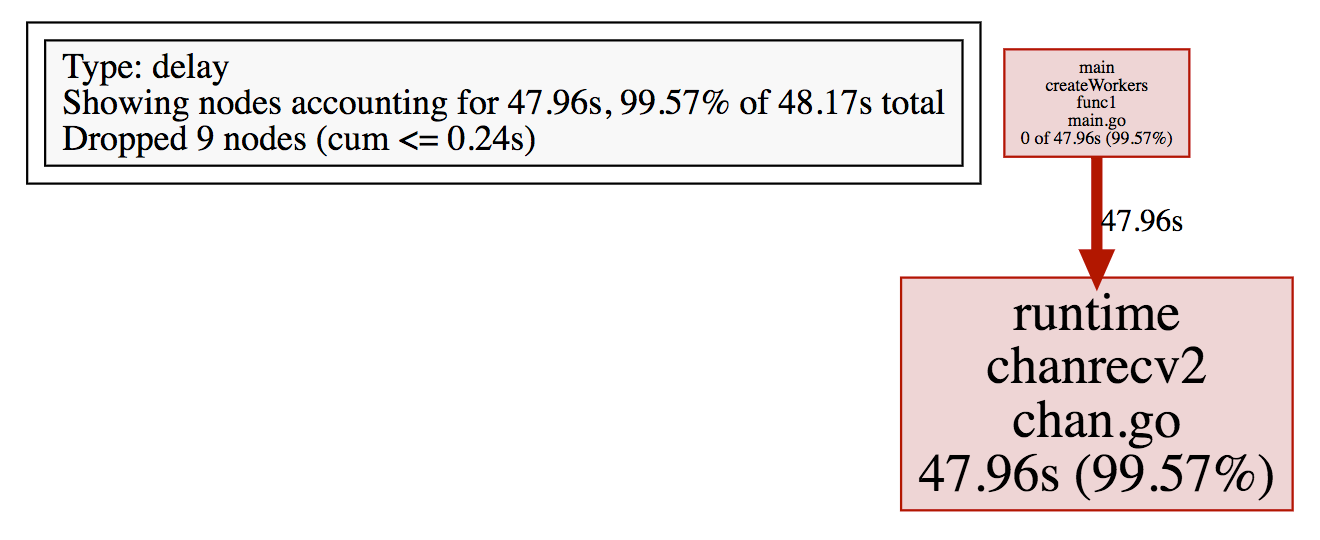
So our goroutines spent almost 48 seconds blocked receiving from a channel! That’s, obviously, a problem.
Why is this? Our channel is being used as a way to communicate between the main goroutine sending pixels, and the workers. This happens 4 million times, which causes a lot of contention. How could be avoid most of this contention?
Buffered channels!
Buffered channels in this case will make most of the send and receive operations non blocking! You don’t trust me? You don’t need to. Let’s modify the program to use a channel with a buffer of a size that allows us to fit all of the pixels.
func createWorkersBuffered(width, height int) image.Image {
	m := image.NewGray(image.Rect(0, 0, width, height))	type px struct{ x, y int }
	c := make(chan px, width*height)
The rest of the function is exactly as the previous one.
Will this make our program faster? Let’s see!
$ time ./mandelbrot
./mandelbrot  8.55s user 0.37s system 494% cpu 1.804 total
It is much faster than before but still not nearly as fast as creating one goroutine per column.
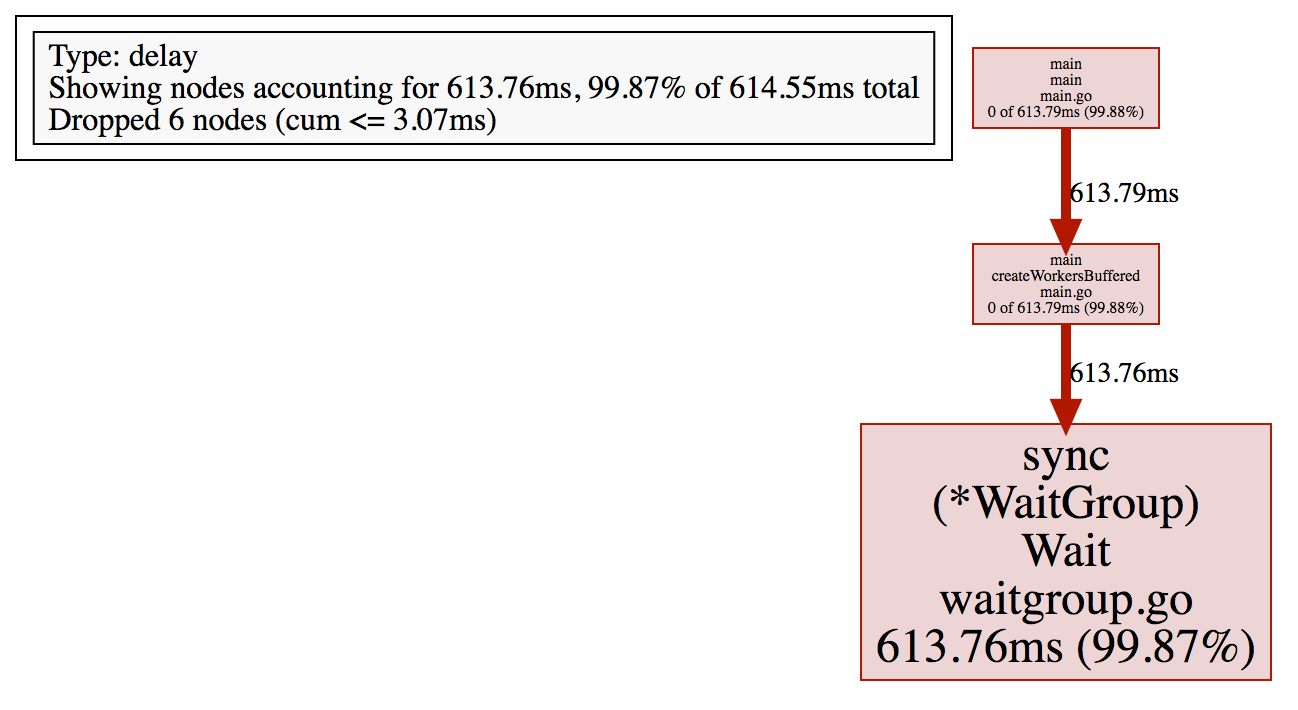
The tracer shows that we still have some contention, and pprof quantifies it to 613ms.
$ time ./mandelbrot > workers-buf.trace
./mandelbrot > workers-buf.trace  8.06s user 0.29s system 542% cpu 1.539 total$ go tool trace workers-buf.trace
2017/10/23 12:04:51 Parsing trace...
2017/10/23 12:04:51 Serializing trace...
2017/10/23 12:04:51 Splitting trace...
2017/10/23 12:04:51 Opening browser
Compromises
Sending values through channels has a very low cost, but it does have a cost and we’re doing this over 4 million times in this program.
It seems like a good idea to limit this cost by creating fewer tasks. How can we even do that? Each task should be larger: let’s create a task per column.
func createColWorkers(width, height int) image.Image {
	m := image.NewGray(image.Rect(0, 0, width, height))	c := make(chan int)	var w sync.WaitGroup
	for n := 0; n < numWorkers; n++ {
		w.Add(1)
		go func() {
			for i := range c {
				for j := 0; j < height; j++ {
					m.Set(i, j, pixel(i, j, width, height))
				}
			}
			w.Done()
		}()
	}	for i := 0; i < width; i++ {
		c <- i
	}	close(c)
	w.Wait()
	return m
}
How much faster is this?
$ time ./mandelbrot
./mandelbrot  4.72s user 0.04s system 495% cpu 0.962 total
Pretty fast! And if we added a buffer to the channel, as shown in createColWorkersBuffered?
$ time ./mandelbrot
./mandelbrot  4.74s user 0.04s system 513% cpu 0.931 total
Just a tiny bit better.
Conclusion
So, it seems like creating one goroutine per column is the fastest option, but probably this changes given different image sizes. It is time to write benchmarks (they’re already written in the repo!), look at the traces and pprof data and make sensible and informed decisions.
We saw how pprof allows us to see how our program uses the CPU and how much locking contention exists. Pprof also provides a way to profile memory allocations which we didn’t cover. On the other side we saw the tracer, that allows us to have a very detailed view of what our program does, specially when our program doesn’t do much!
I hope you enjoyed this post, let me know what you think at @francesc and subscribe to #justforfunc for more content every two weeks!
Recommend
About Joyk
Aggregate valuable and interesting links.
Joyk means Joy of geeK